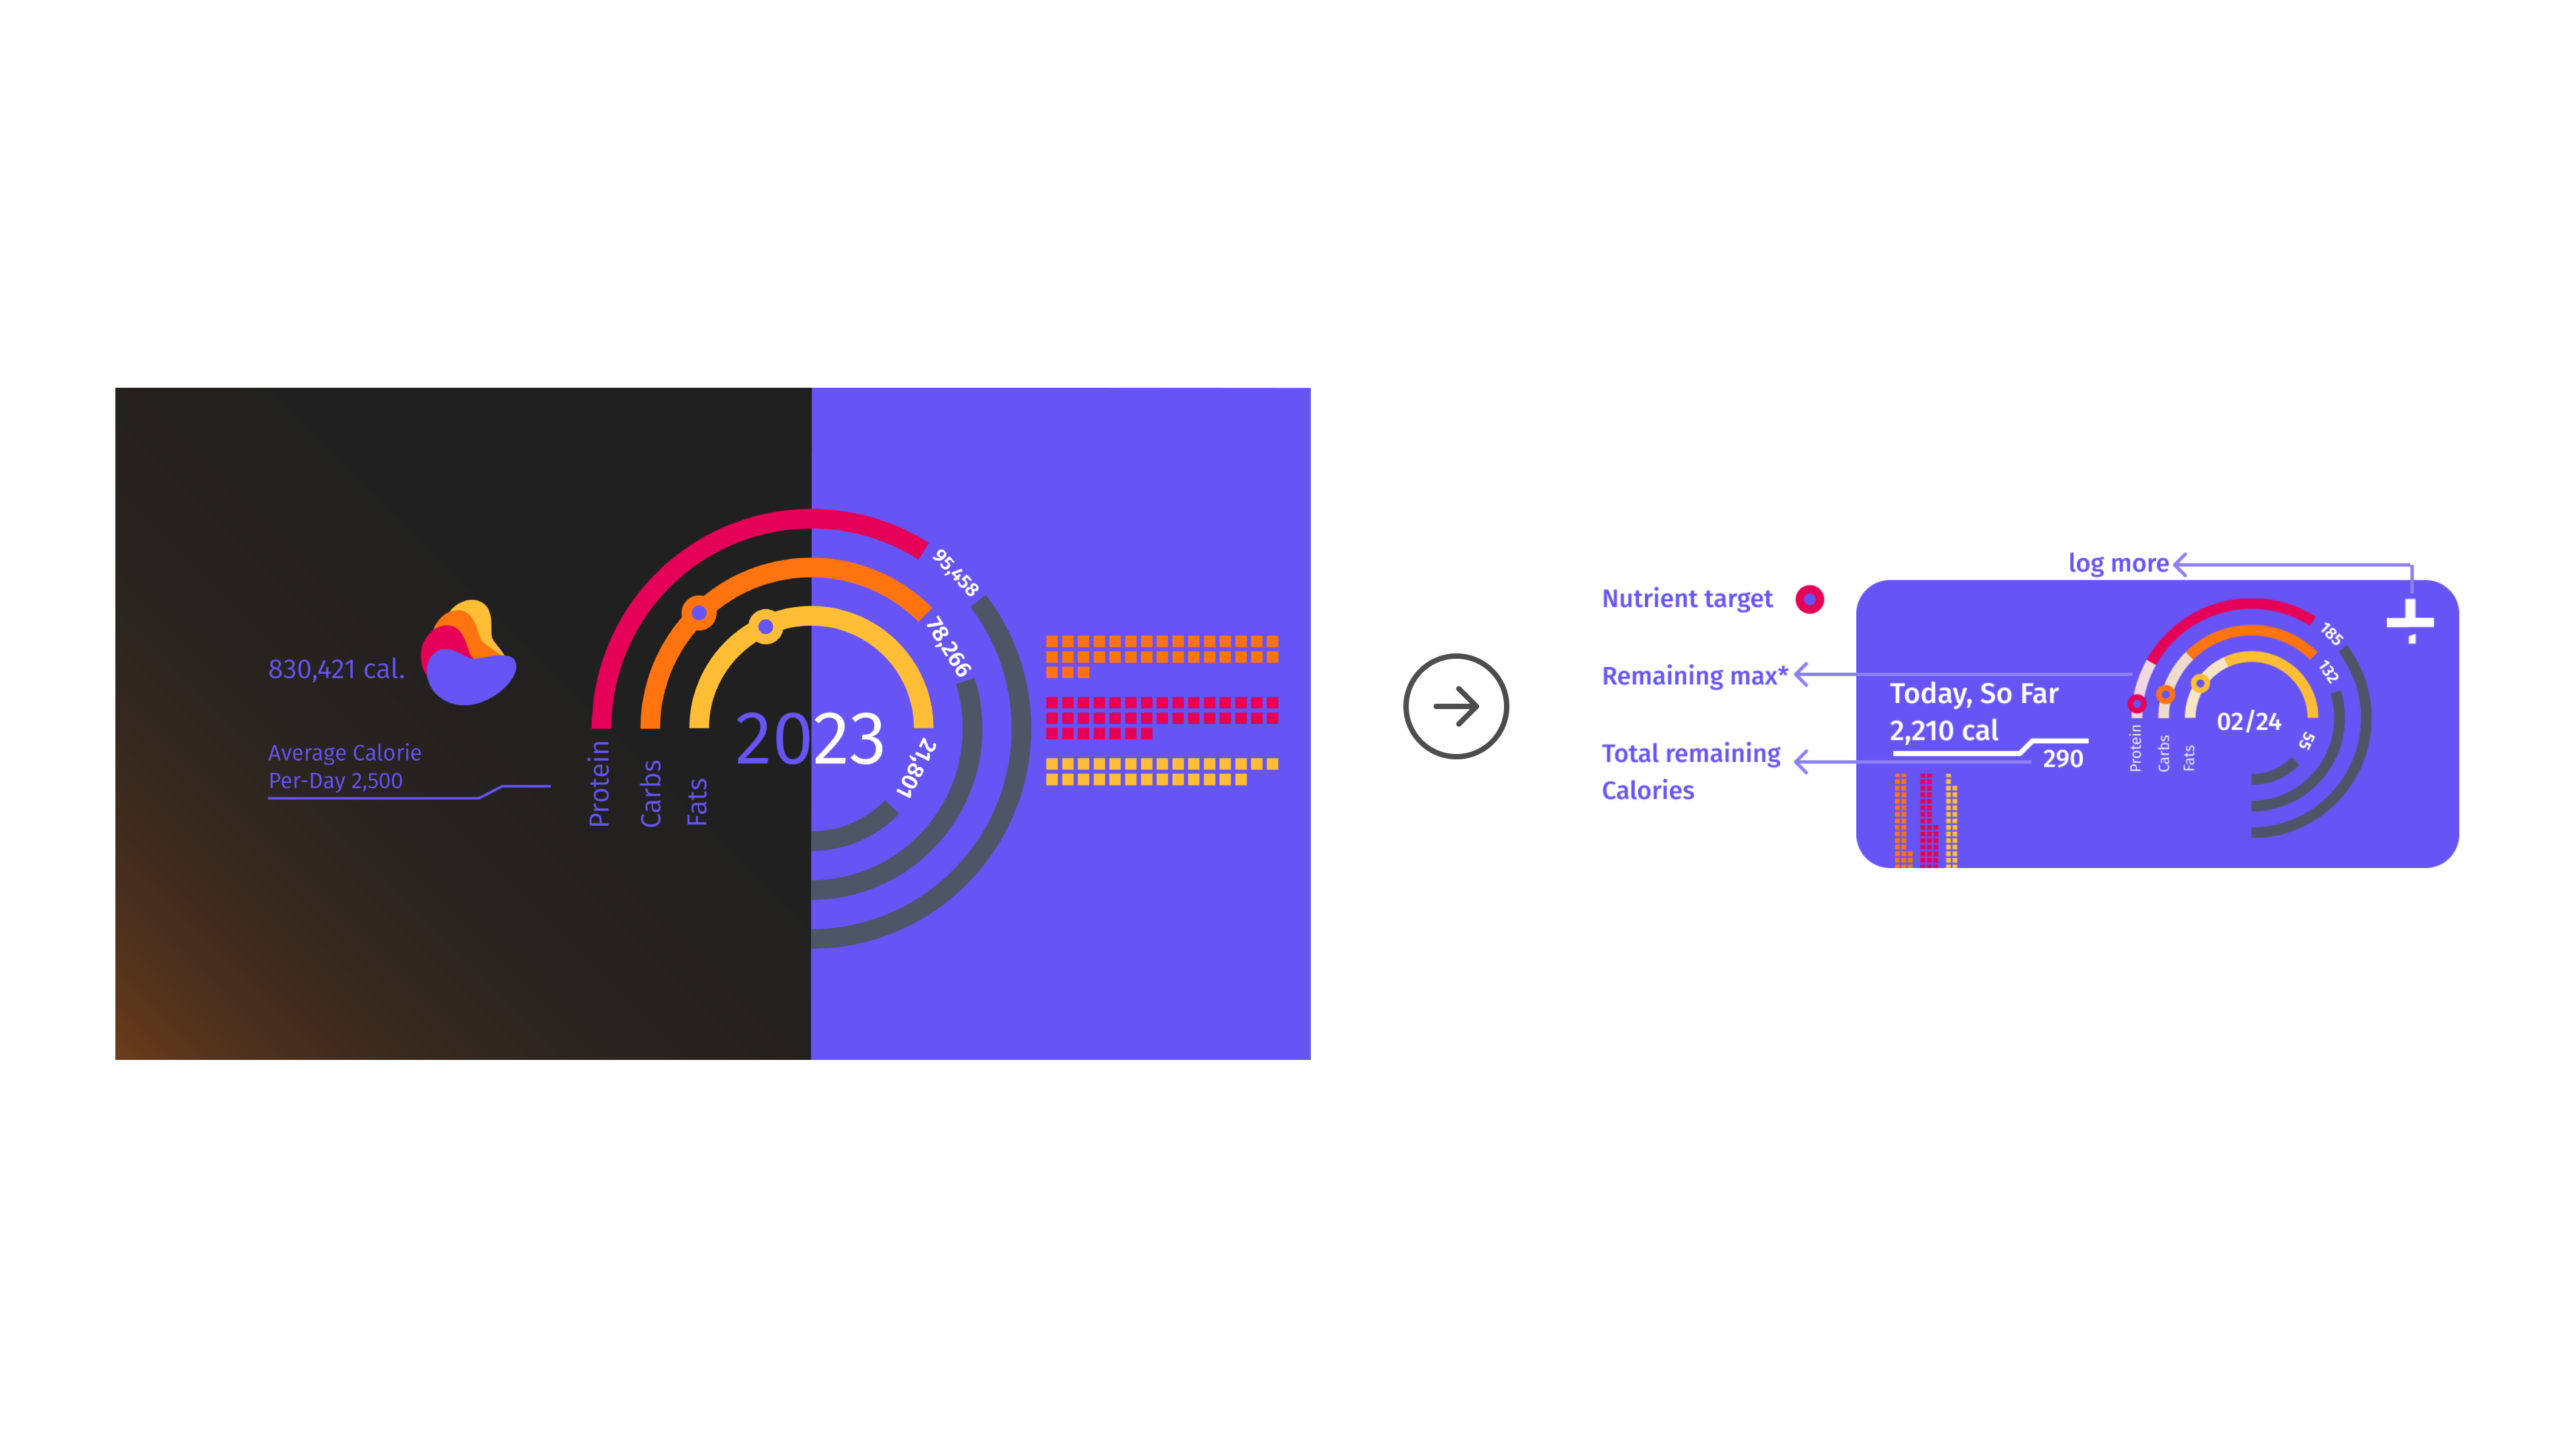
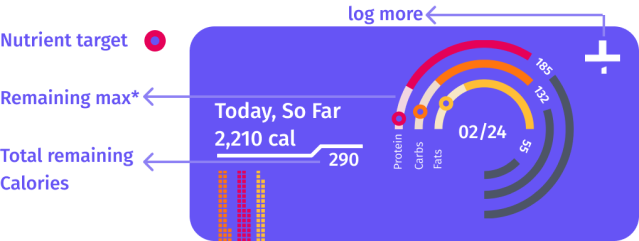
Clarification
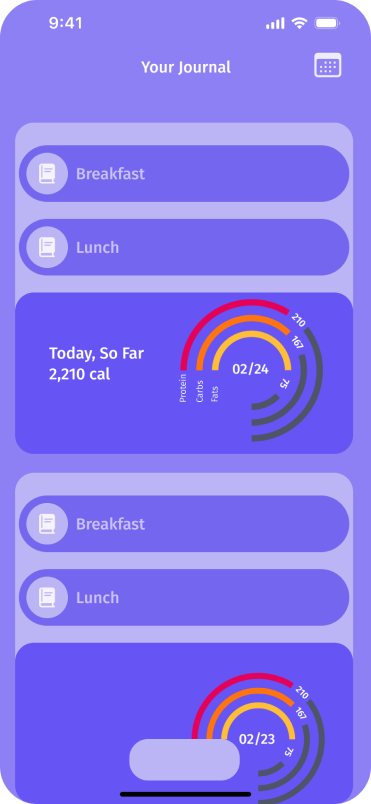
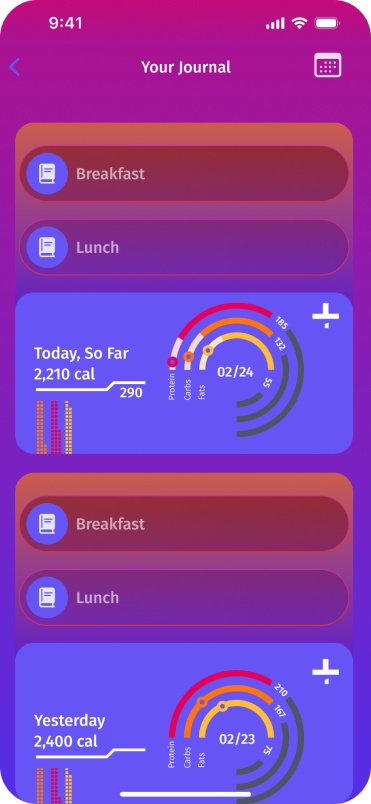
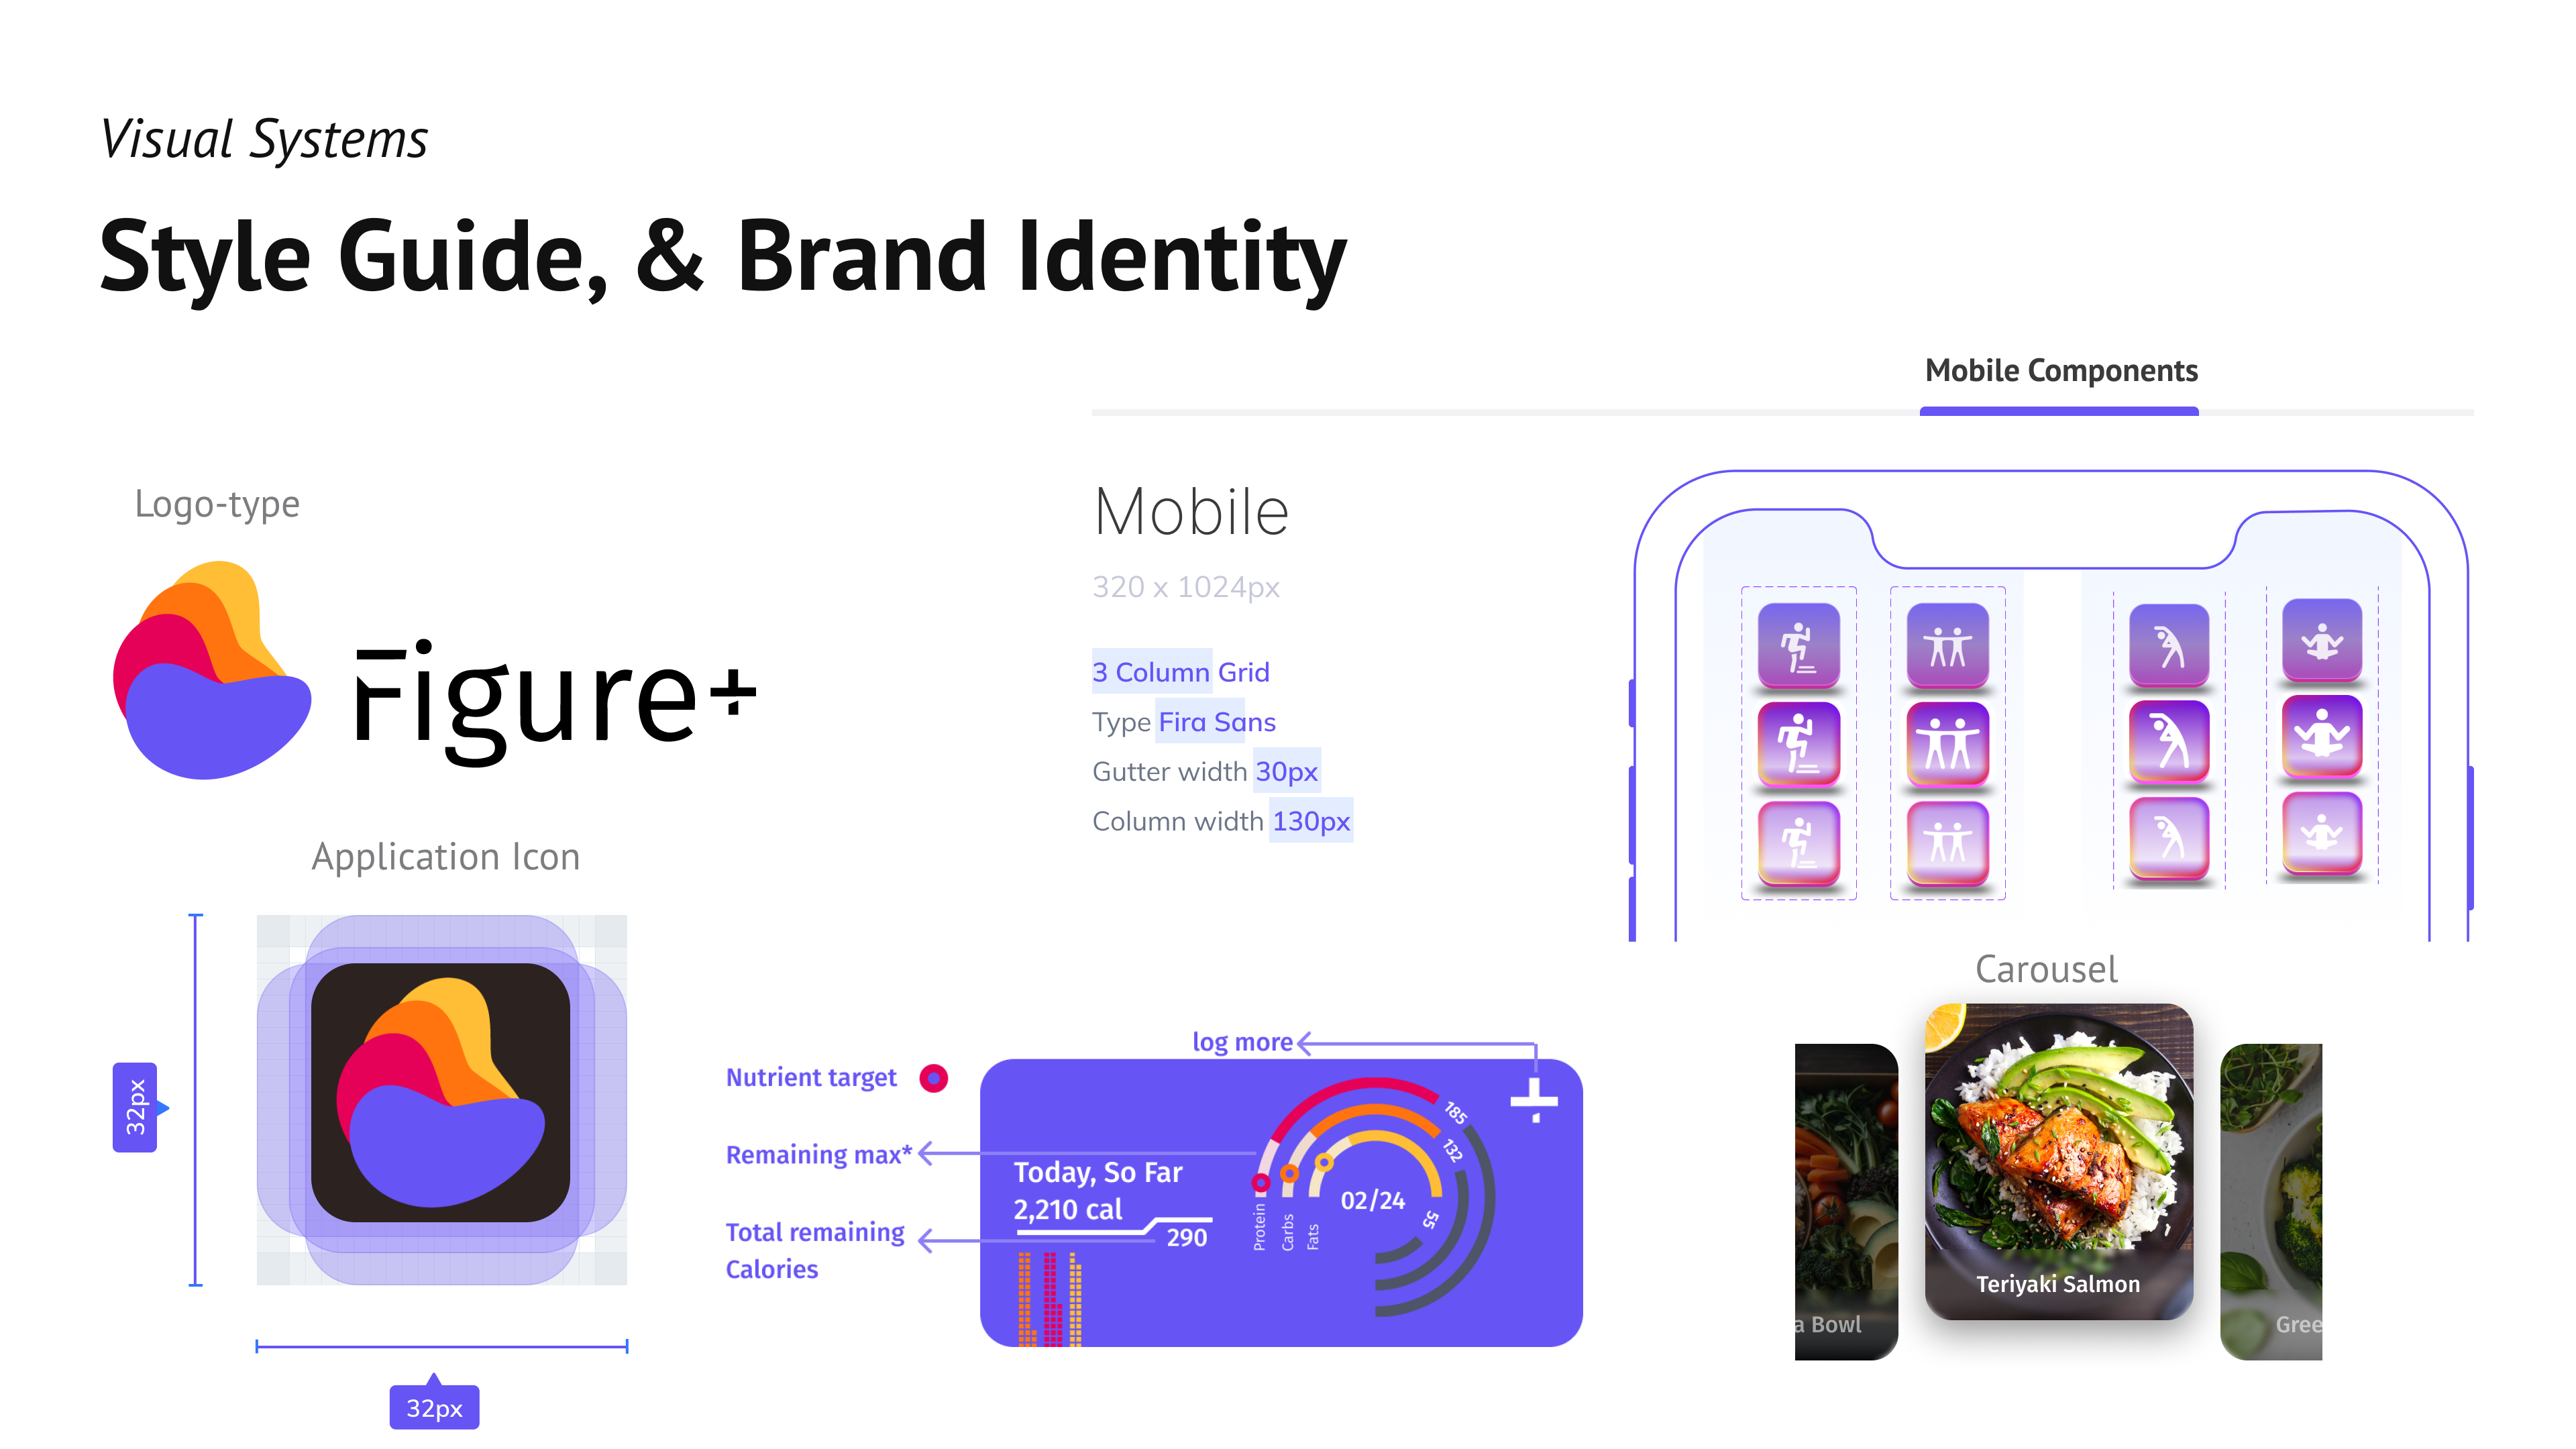
- Included an indicator for user daily nutrient target, based on their profile goals.
- Included visual distinction between remaining and consumed calories.
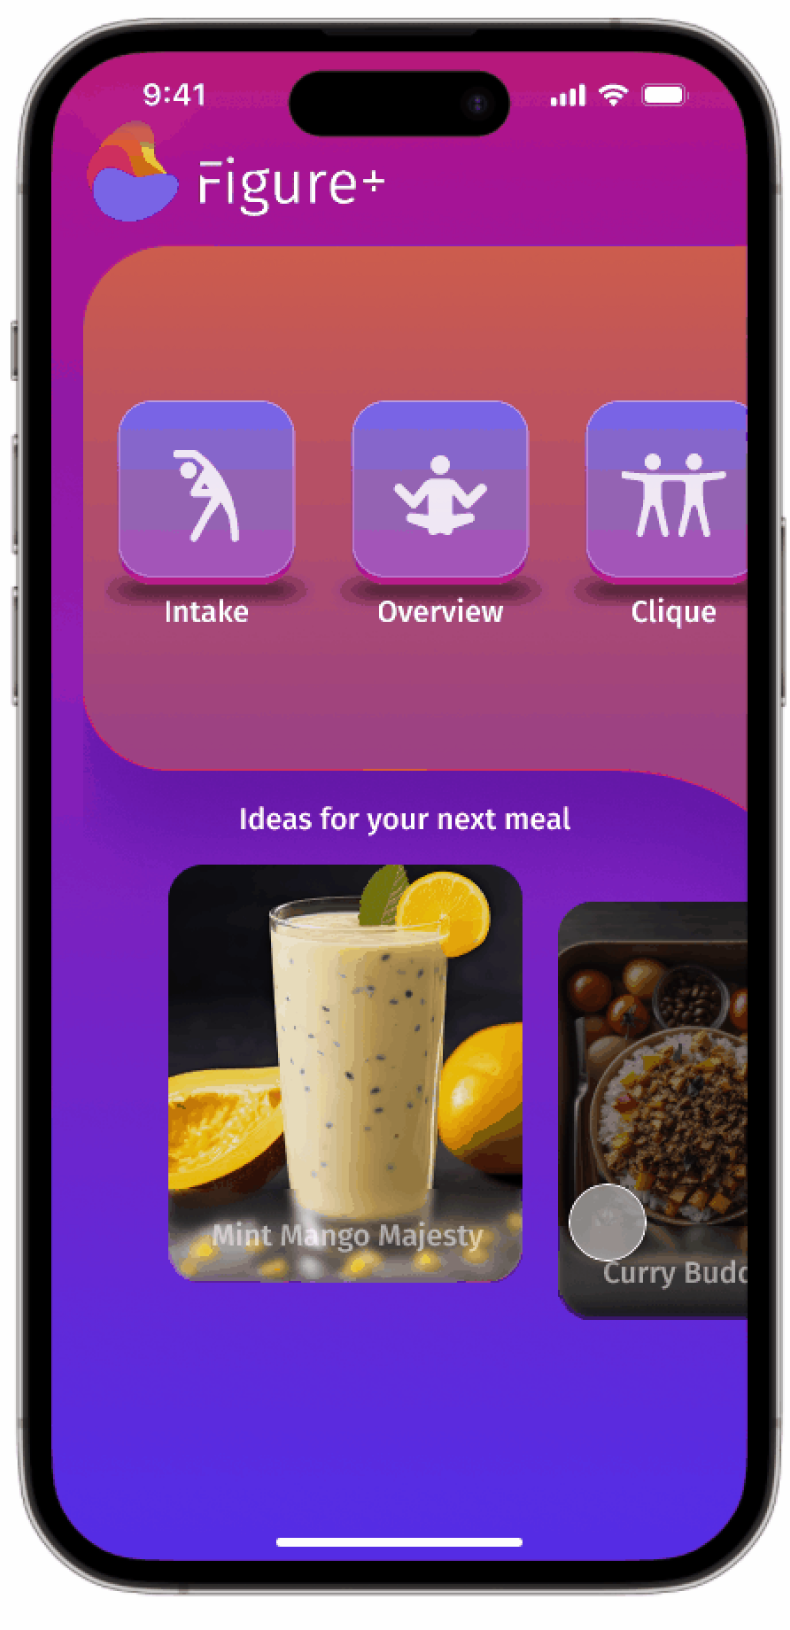
- Removed bottom navigation.
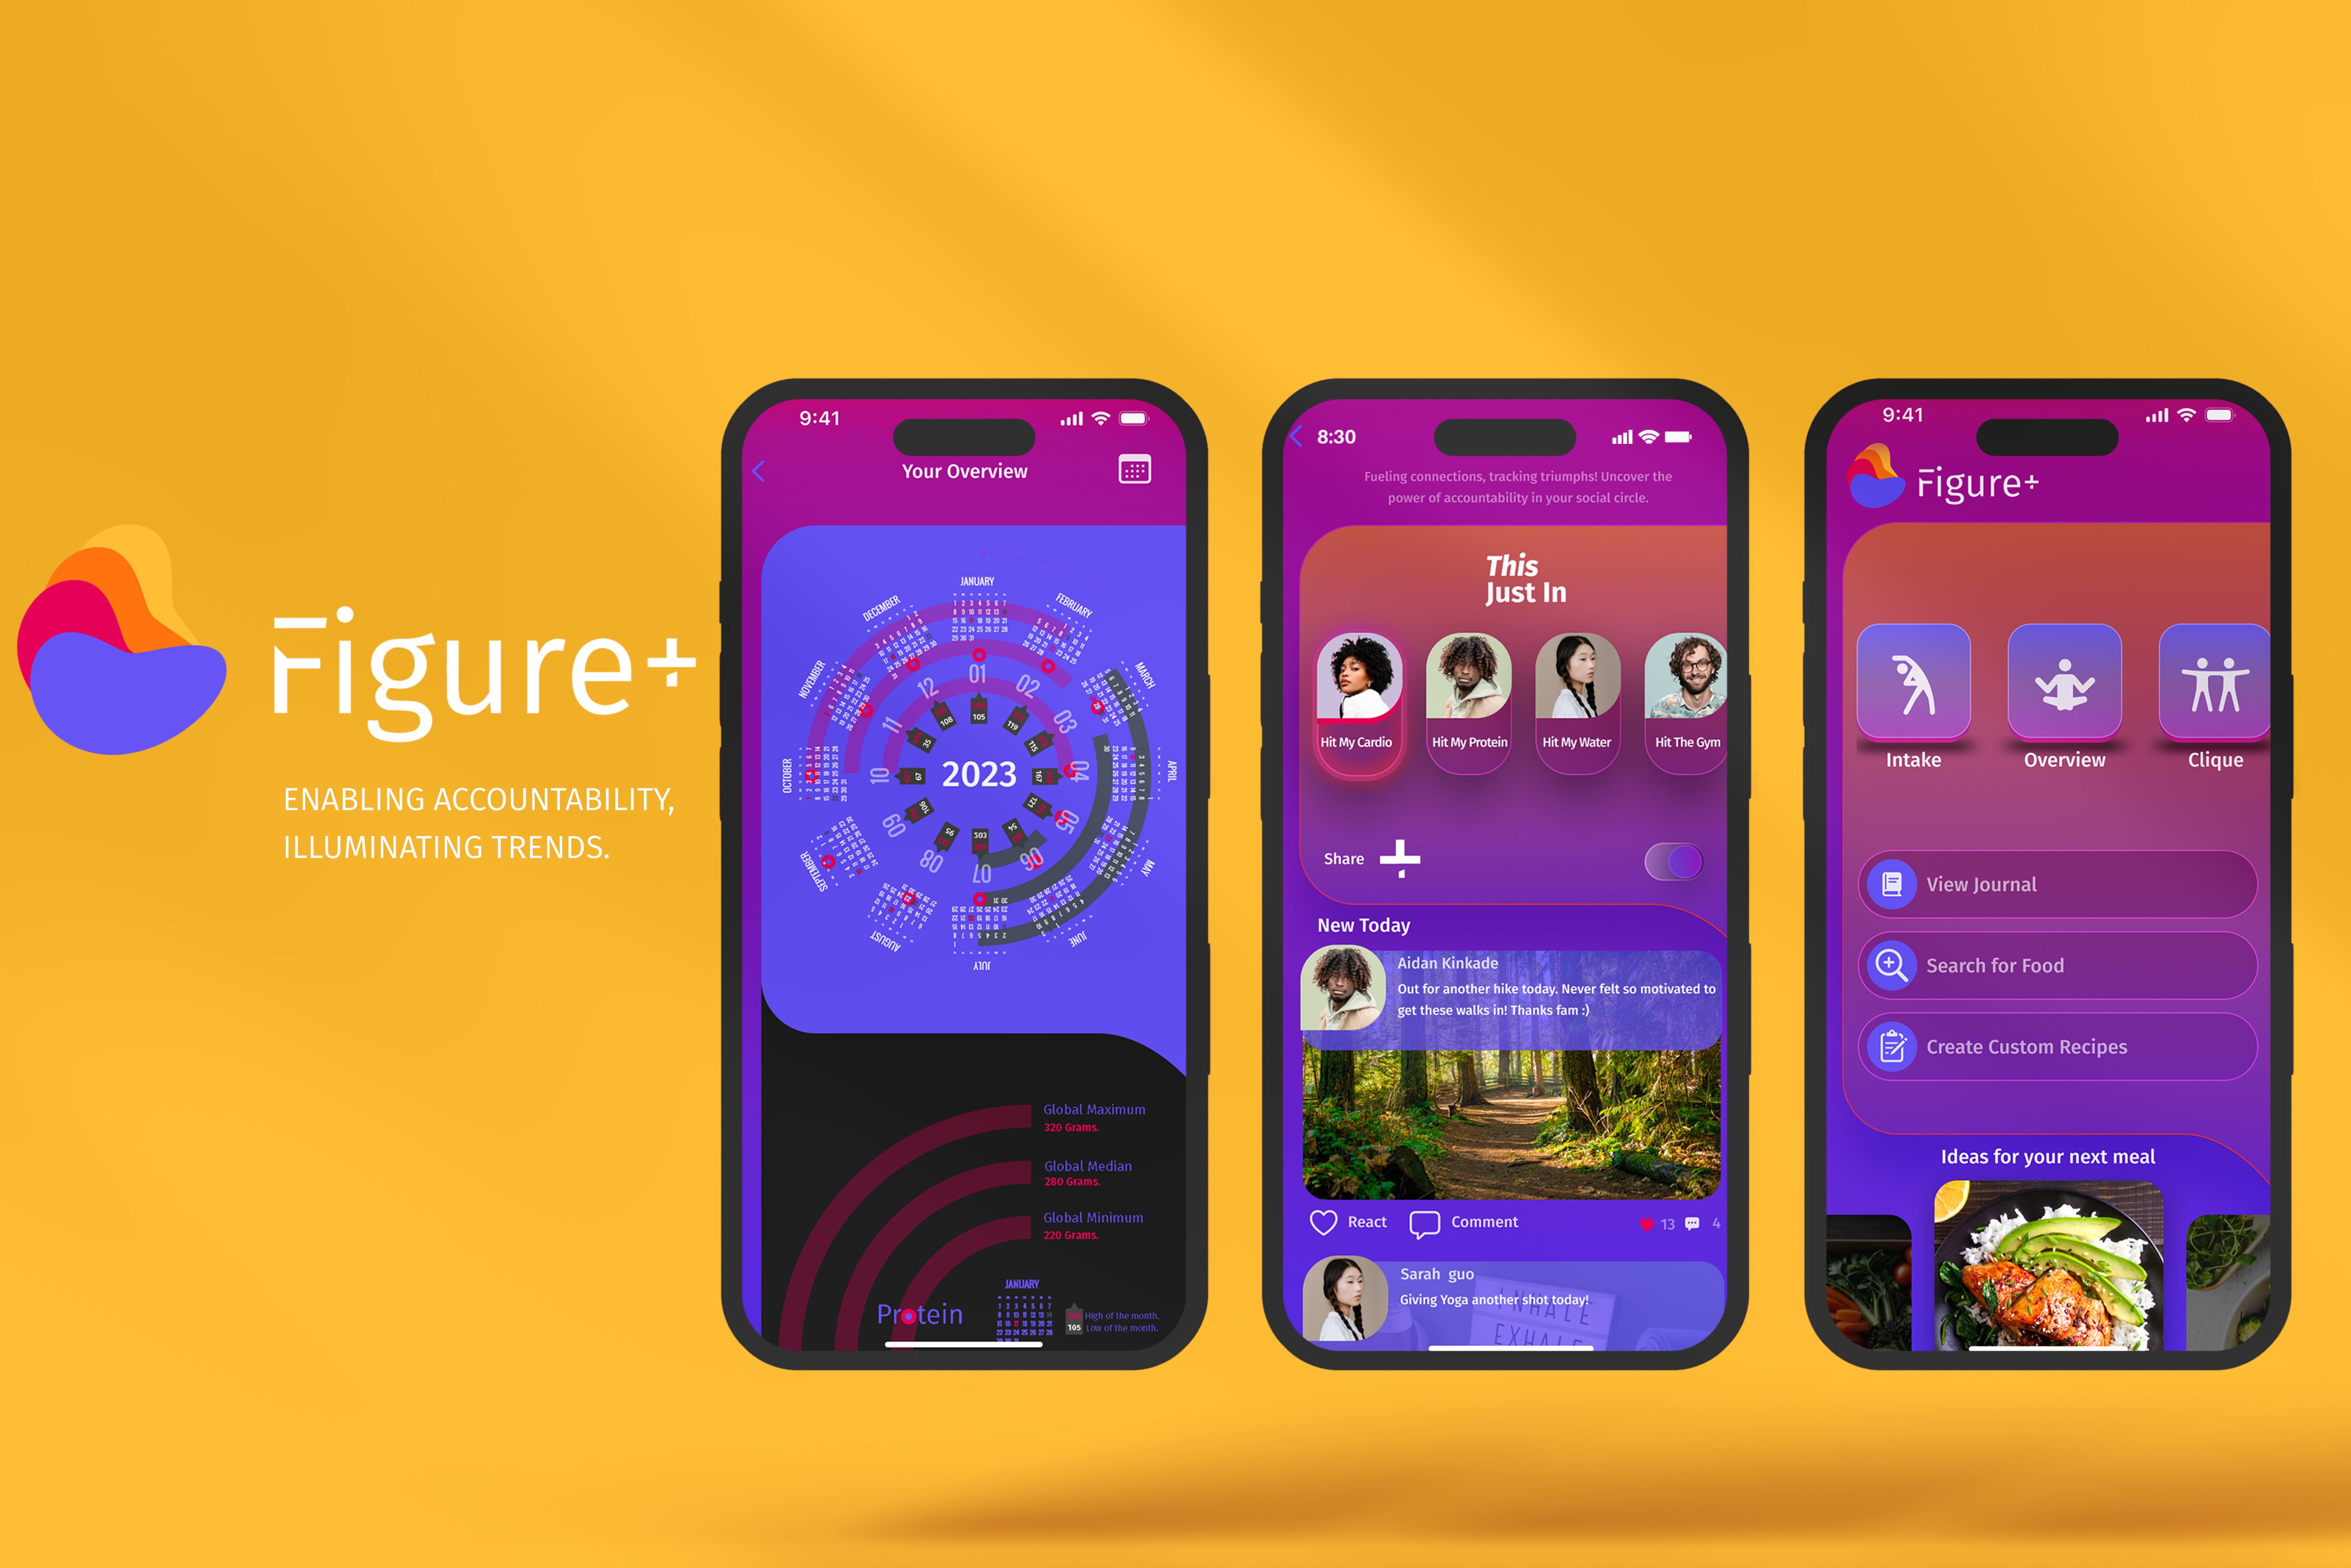
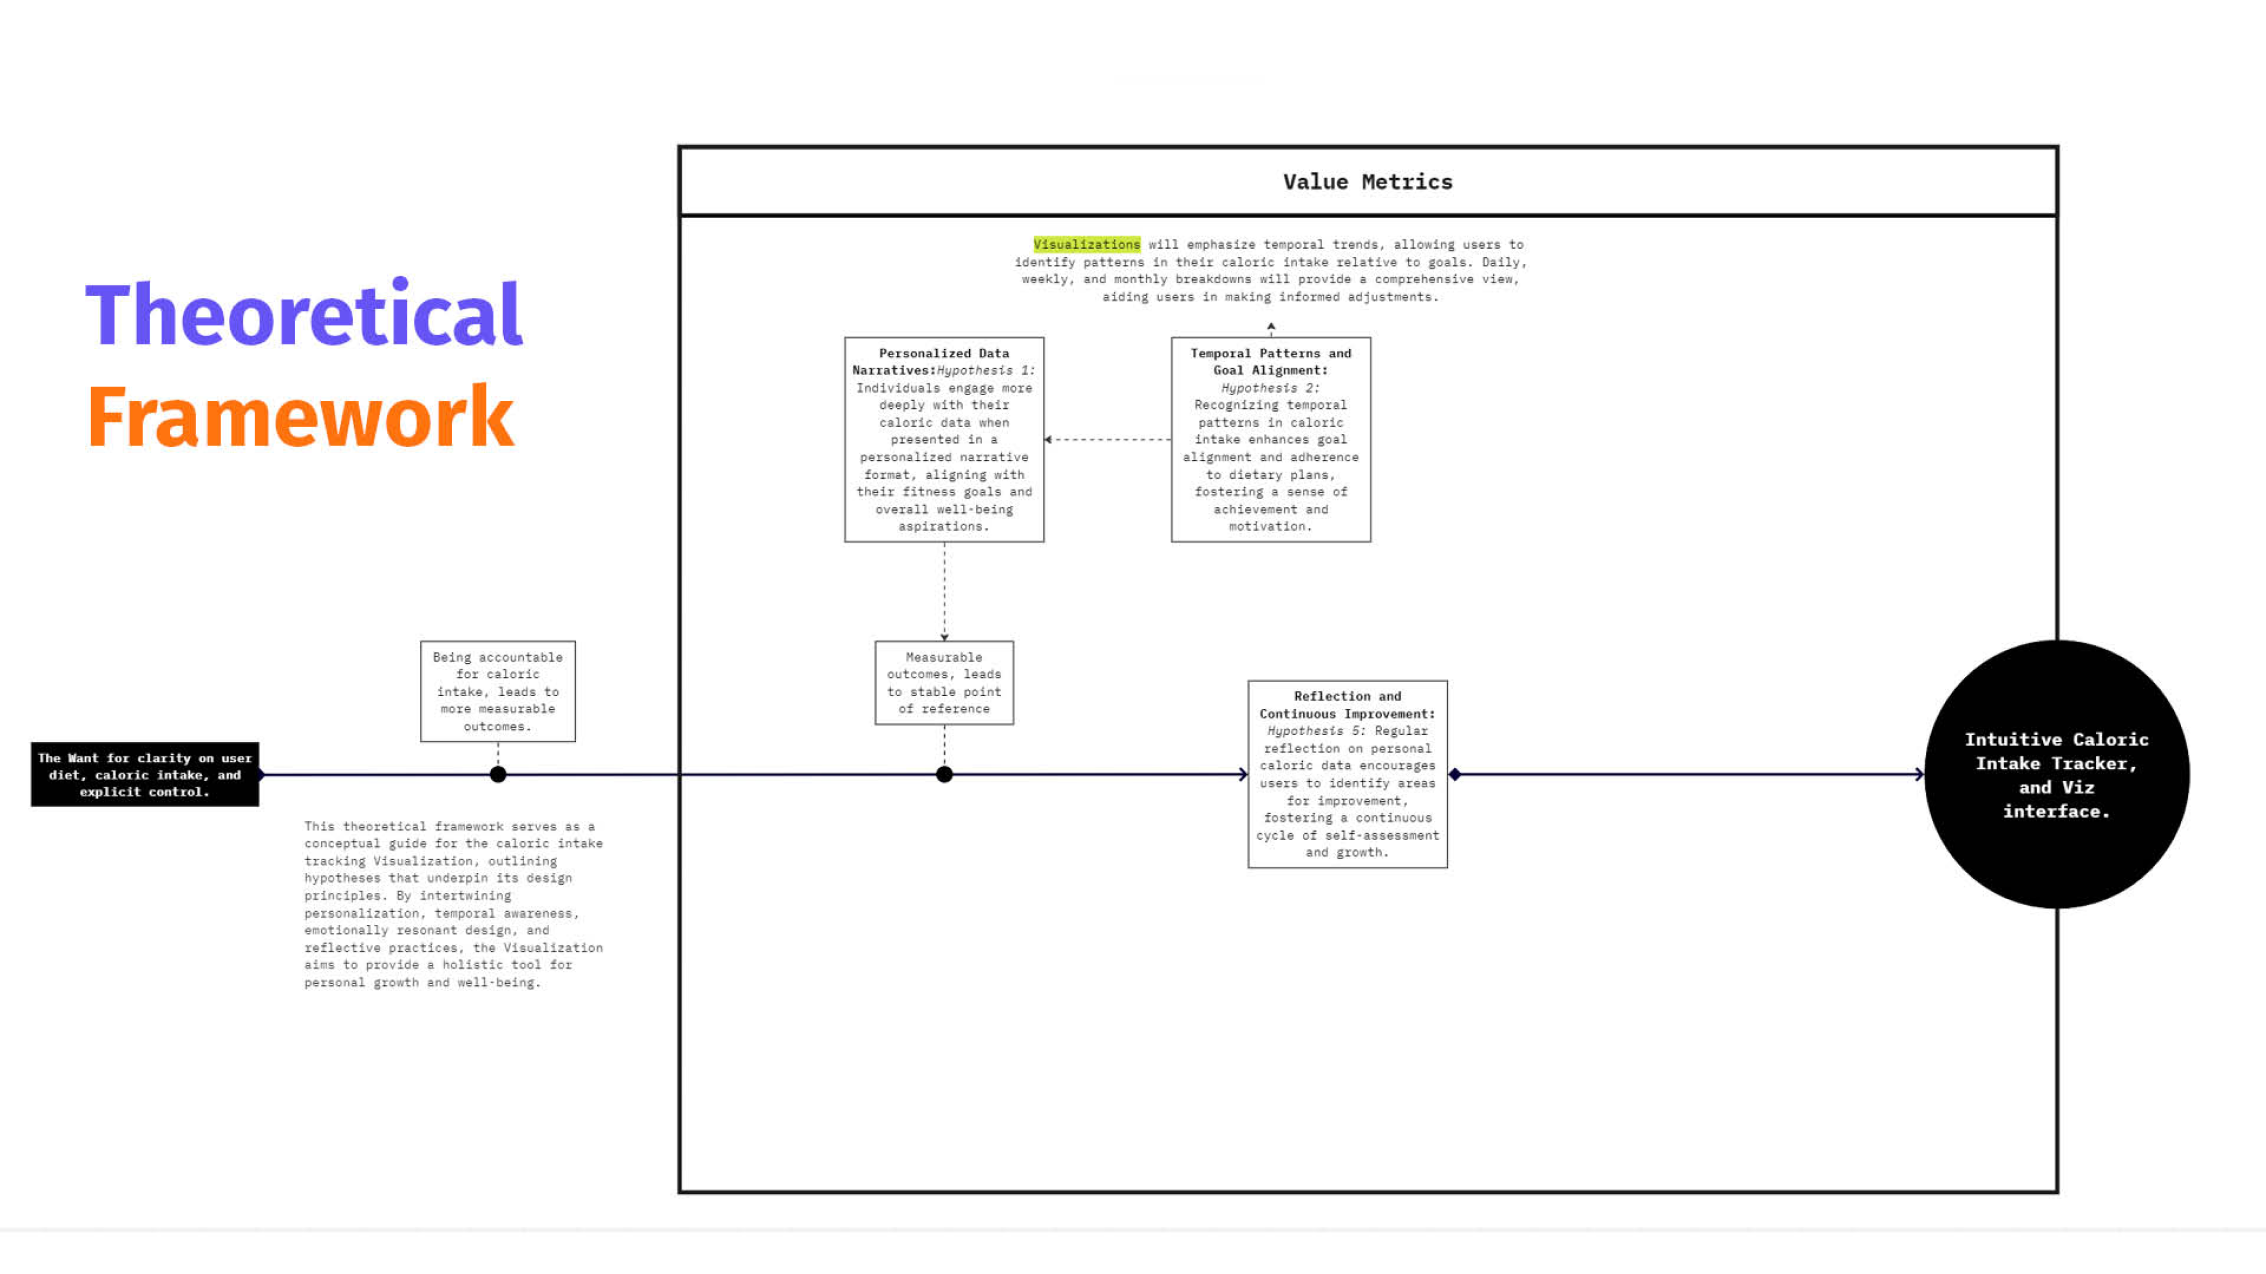
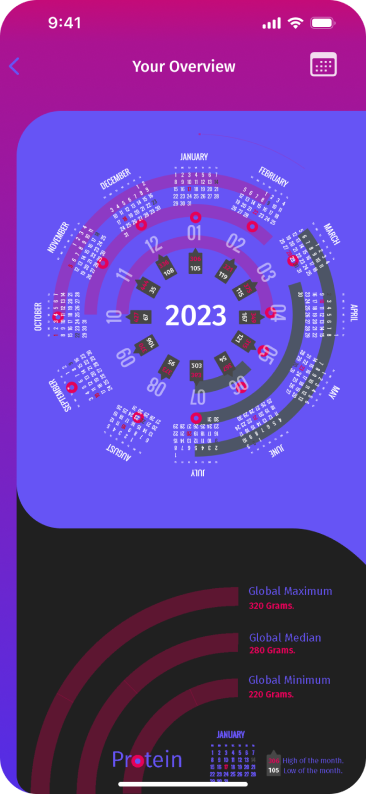
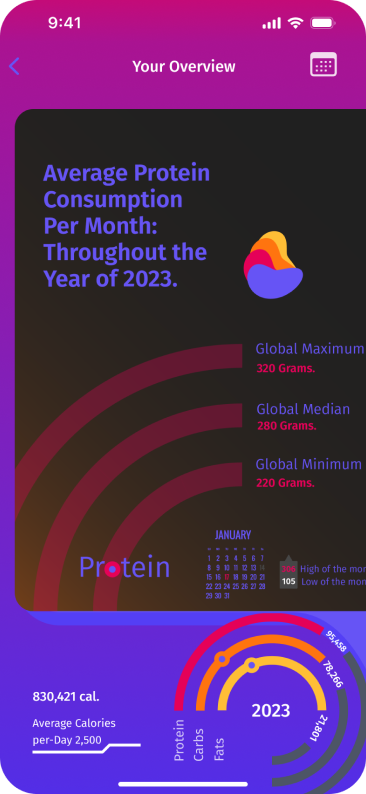
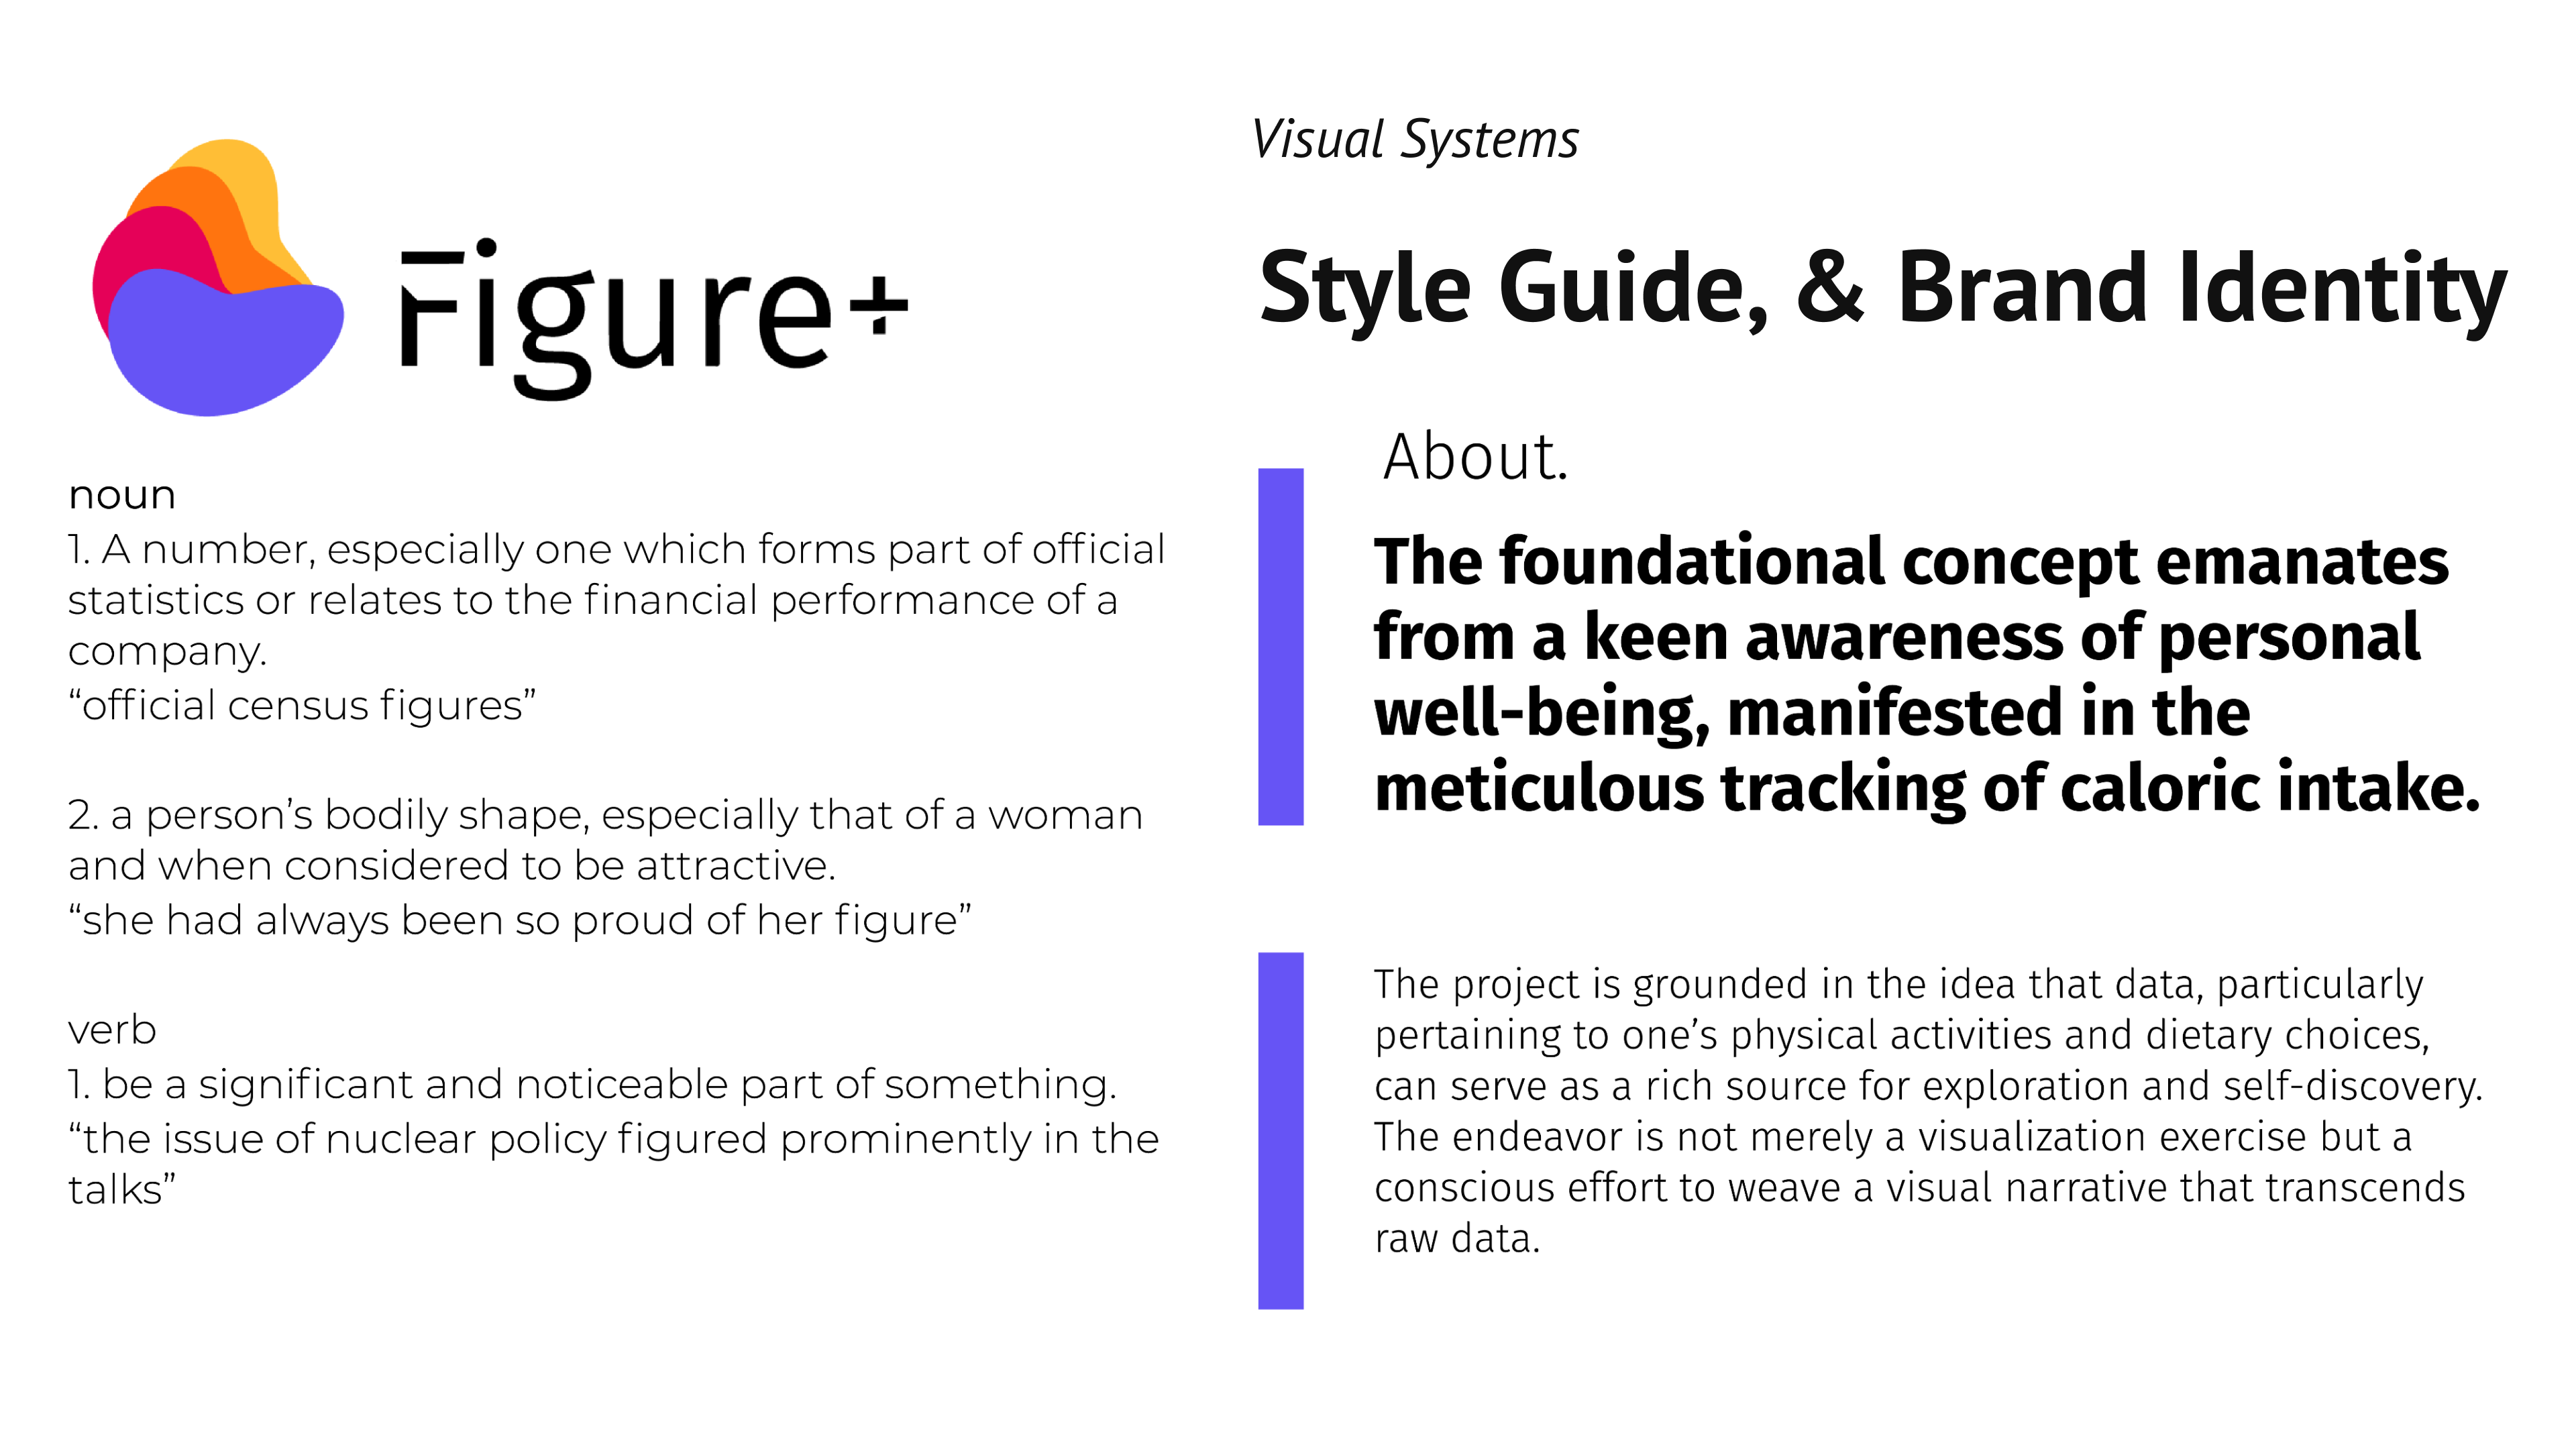
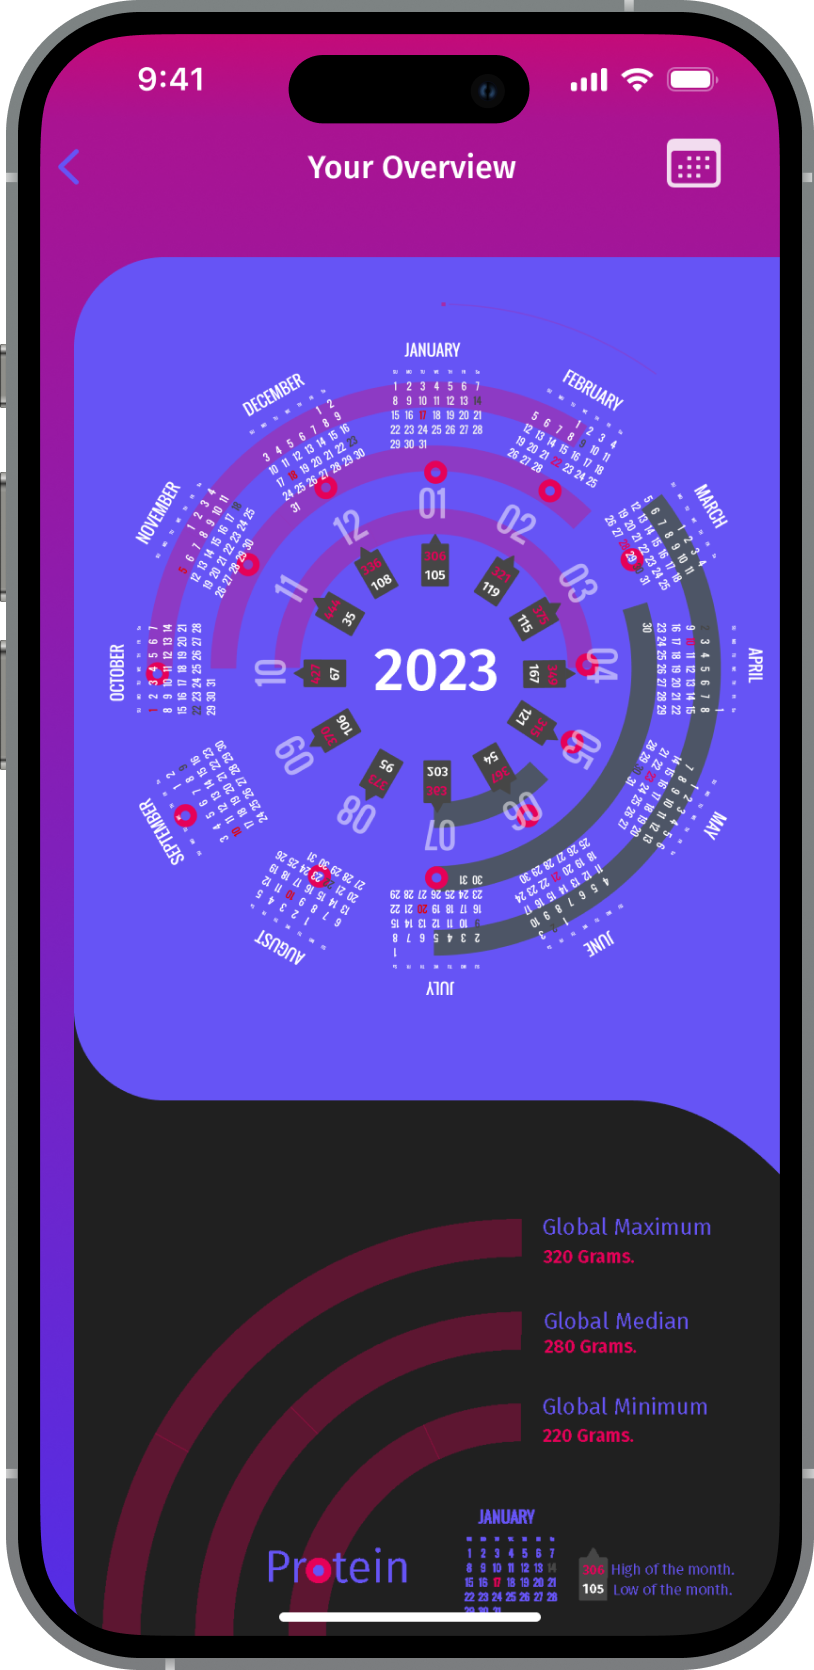
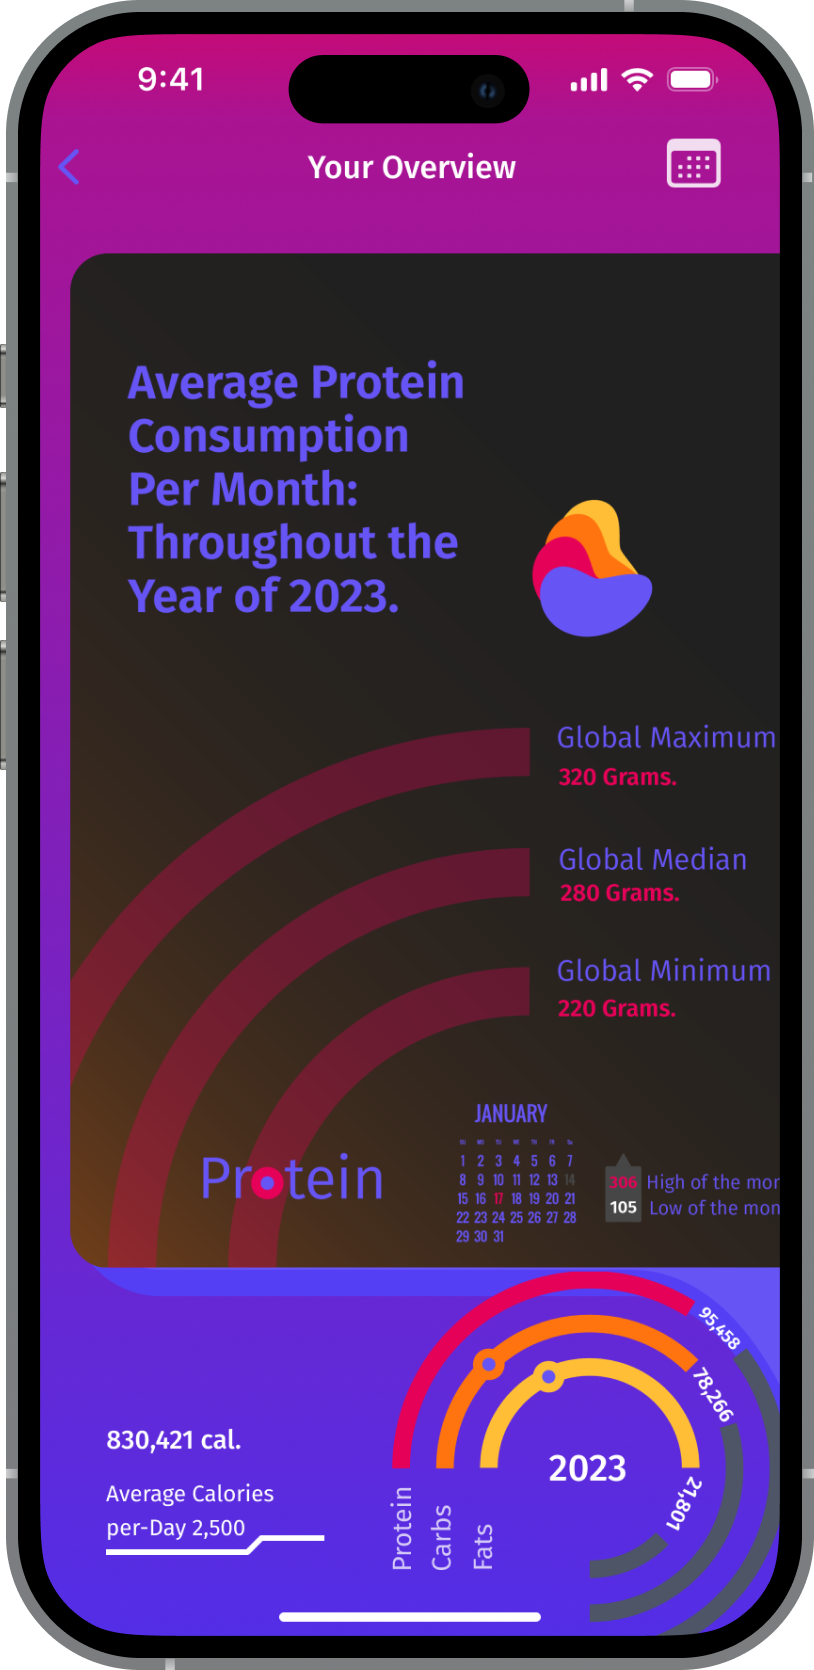
A mobile application designed to enhance the dietary journey of users’ leveraging principles
of Data Humanism to provide visually engaging personalized data narratives.
The application highlights users temporal patterns, emphasizing goal alignment, enabling reflection, and continues improvement.
With a social component that hinges on the concept of accountability, social support, and extrinsic motivation. Intended to enable goal adherence, and user successes.
UX/UI Researcher, UI Designer, Product Designer, Data Visualizer
Excel, Tableau, Adobe Illustrator, Figma
Me, Myself, & I
5-Weeks
A 2023 meta analysis of 35 medial papers found that lifestyle interventions that foster self-regulatory skills, opportunities for social engagement and personalization of goals were identified as factors seen to improve behavioral-adherence.
Having a specific accountability appointment with someone you’ve committed to will raise those odds to 95%.
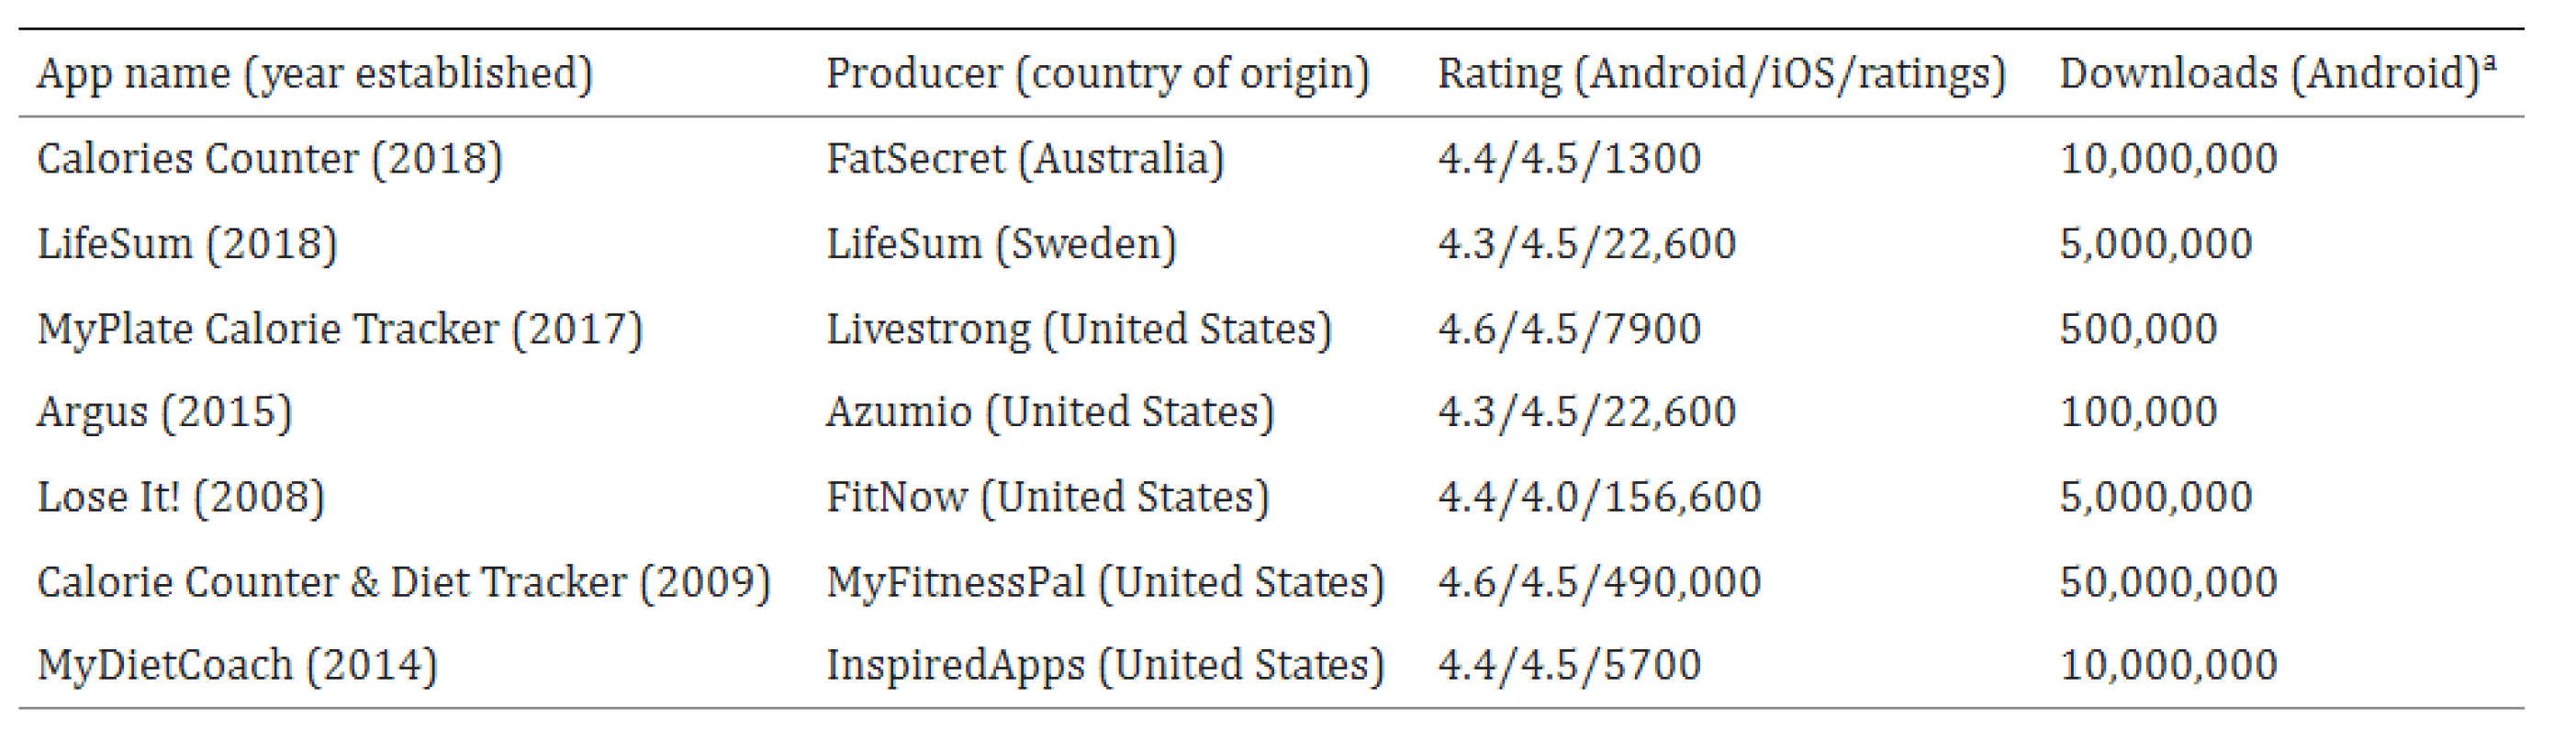
Existing apps lack social and emotional features.
Incorporating Social Interaction: Enhance motivation and goal adherence by embedding social media elements for peer support, accountability, and shared experiences.
Current apps miss tracking emotional impacts on eating.
Emotional Tracking Integration: Foster a supportive environment by enabling users to track and share the emotional aspects of their eating habits, providing deeper insights and encouragement.